Applications
- Virtual Field Trips for K-12 Education (2014+)
- Large Dataset Exploration with Multi-Touch Graph Interfaces (2012+)
- Interactive Monitoring and Prediction of Water Levels around New Orleans (2014-2015)
- VR Exploration of the “Dinosaur Killer” Impact Crater (2004+)
- Welding Simulation (2008-2012)
- Dismounted Soldier Simulation with Omnidirectional Treadmill (2007-2010)
- Isaac Verot Coulee Watershed Visualization (2009-2011)
- Well Log Visualization for Coalbed Methane Exploration (2010-2013)
- Immersive LIDAR Visualization
Virtual Field Trips for K-12 Education (2014+)
Research Assistants: Sam Ekong, Jason Woodworth
VR can bring field-trip-like experiences to K-12 students who are unable to visit real sites due to geographic, economic, or scheduling barriers. Real field trips have promising effects such as long-term information recall, and viewing a facility in person directly communicates size and spatial relationships of objects. VR field trips may provide such benefits without requiring students to leave the home or classroom. VR also allows environments to be augmented with additional educational content, such as embedded educational animations and simulations of rare events. We develop VR-based field trip approaches and assess them directly in high schools. We worked with faculty from other units to apply our approaches to applications such as energy education and offshore training.
We refer to our VR field trip approaches as “Kvasir-VR” and describe them further on our page about Networked VR and the example Virtual Energy Center Application.
Images
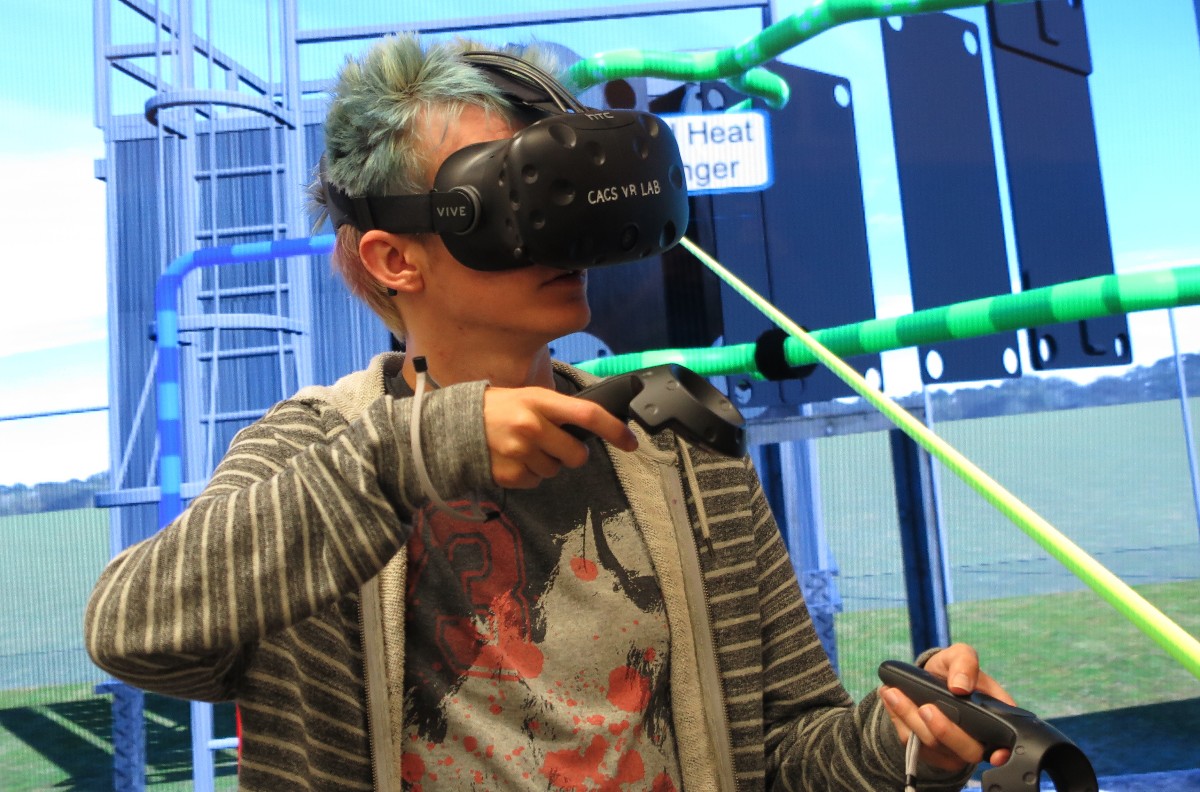
A user immersed with the HTC Vive explores a station in the Virtual Energy Center application. Wands are used to interact with machine components to trigger educational visuals.

A student at a local high school participates in an experiment to assess live (networked teacher) and standalone VR field trip approaches.
Video
Publications
- IEEE VR 2018 paper overviewing Kvasir-VR and evaluating networked and standalone approaches (PDF) (Video) (DOI)
- IEEE Workshop paper from “Everyday Virtual Reality 2017” discussing a TV-based teacher interface and evaluating visual pointing cues . (PDF) (DOI)
- IEEE VR 2017 demo abstract about the teacher-student collaboration interface. Winner of the “Best Research Demo” award. (PDF) (DOI)
- ISVC (Visual Computing) paper describing techniques for mesh streaming, rendering, and the teacher’s interface (PDF) (DOI)
Large Dataset Exploration with Multi-Touch Graph Interfaces (2012+)
Research Assistant: Nicholas Lipari
We worked on a framework for exploring large datasets about disease relationships in a population, communication on social media, and citations between academic papers. Data analysts can benefit from improved interfaces for discovering and explaining relationships and patterns in such data. Our framework integrates machine and human analytics through graph visualization interfaces, for large graph-structured datasets, to let analysts visualize and control analyses on high-performance computing servers. Graph attributes are encoded into visual properties (e.g. animations, transparency, and color). Users can sample or summarize the graphs based on a variety of algorithms and investigate various graph layouts and interactive plots of centrality metric distributions. An analytics server created as part of our Visual Analytics Sandbox (link) handles the graph metric computations.
Datasets are navigable with multitouch gestures on devices ranging from smartphones to large touch displays. For example, users pinch to zoom, drag to translate (world and objects), and tap to inspect node details. Users can filter nodes and edges based on graph metrics and query the analytics server for relationships within the graph such as the shortest path between two selected nodes. This research was industry-funded over 5 years for the following CVDI projects.
- Real-Time Analysis and Visualization of Multi-dimensional Sensor Data (2012)
- Visual Analytic Approaches to Mining Large-scale Time-Evolving Graphs (2013)
- Visual Analytic Methods for Dynamic Graphs (2014)
- Graph Sampling, Summarization, and Touch-Based Visual Analytics for Large Complex Systems (2015)
- Interactive Visual Exploration of Large Graphs with Enhanced Sampling and Summarization (2016)
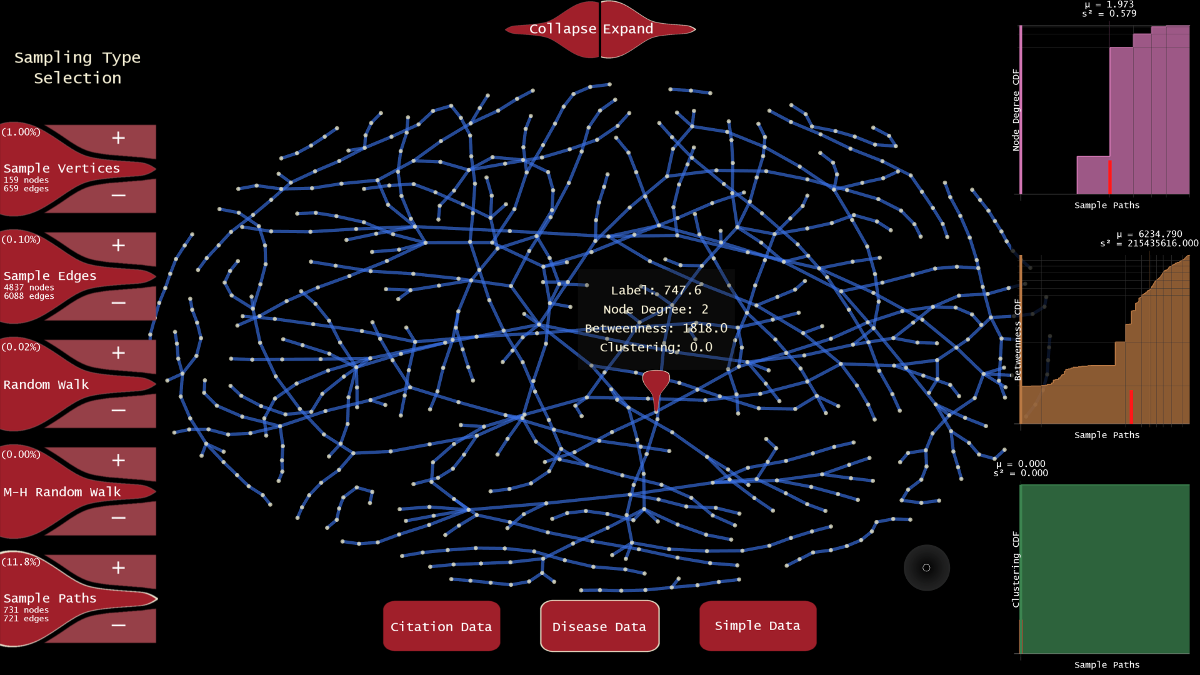
Graph visualization interface with sampling and analytics for exploring relationships between diseases.
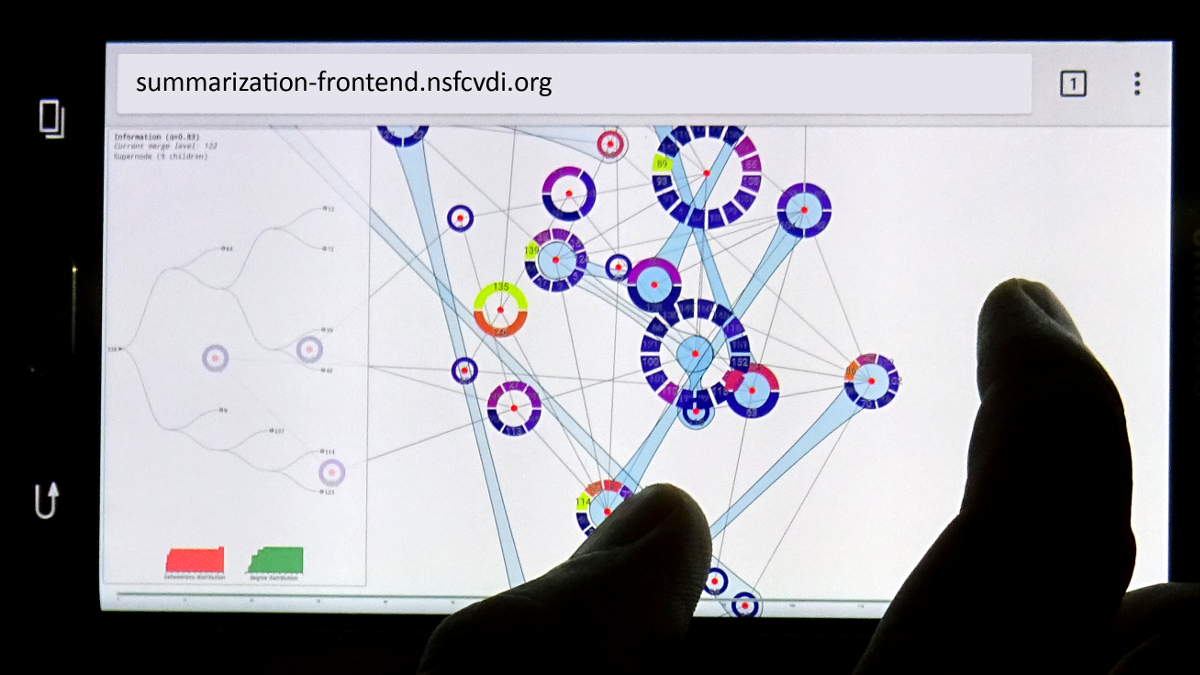
A user browses a summarization of a publication co-citation network. The interface runs on a smartphone and communicates with the analytics server.
Publication
- ISVC (Visual Computing) 2016 paper describing our graph sampling and summarization application. We implemented several unbiased sampling techniques to facilitate large scale graph analysis and combined algorithmic processing with human interpretations. (PDF) (DOI)
Interactive Monitoring and Prediction of Water Levels around New Orleans (2014-2015)
Research Assistants: Mores Prachyabrued and Nicholas Lipari
In areas vulnerable to hurricanes, like New Orleans, it is important for specialists to be able to understand flood water events and predictions. We built a visualization and exploration system for monitoring real-time streaming sensor data, histories, and forecasts of imminent water level events. The details of rising levels during major weather events can be explored over a wide area and time frame, allowing responders to assess hazards such as levee breaks to warn and proactively evacuate at-risk communities.
The analysis tool used our touch interfaces for navigation and selection (including Handymap, Handymenu, and multi-touch monitors). Interactable objects allow users to navigate the scene and view details of barometric and water stage sensors, including histories, predictions, and current status, in interactive plots.

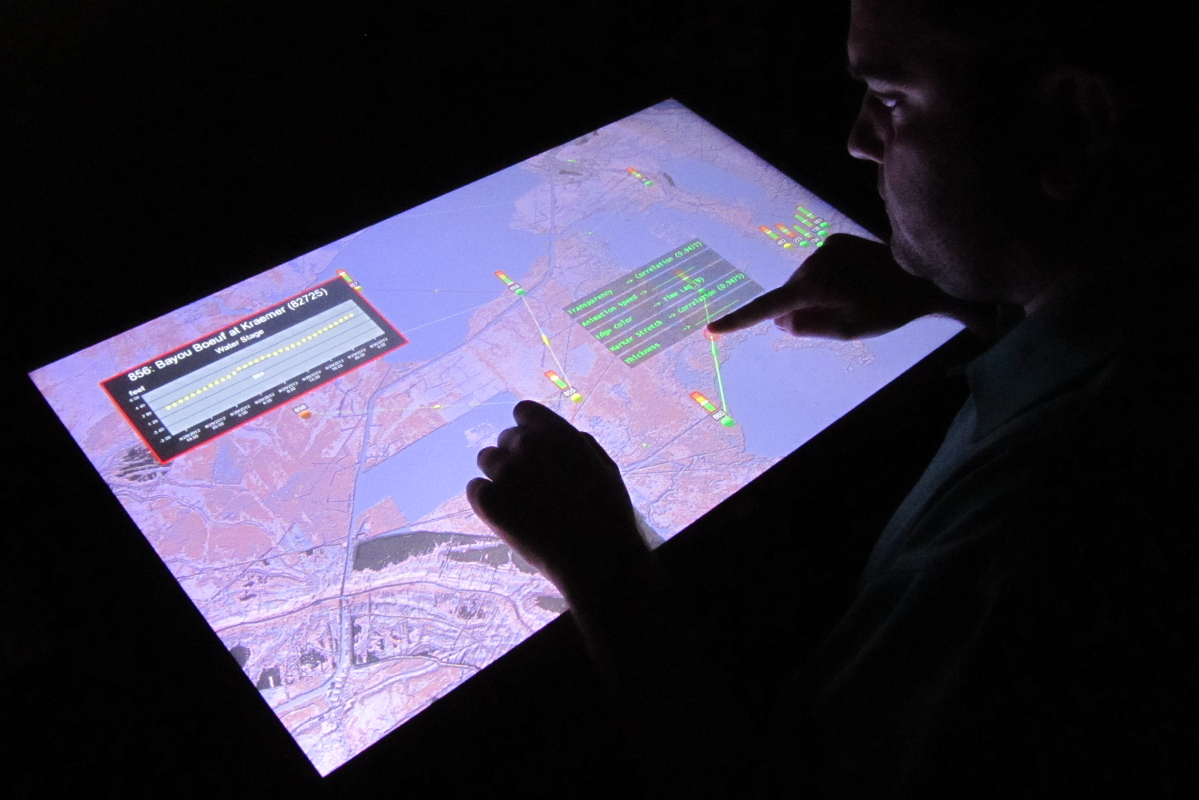
A user browses a history of flooding measurements around New Orleans, LA during Hurricane Isaac in 2012.
(Left) The Handymenu is used to browse water stage data from hydrology sensors. (Right) A multitouch table is used to assign dataset values to visual properties.
Video
Publication
- IEEE 3DUI 2015 paper describing the Handymenu interactions and comparing them to standard VR techniques. (PDF) (DOI)
VR Exploration of the “Dinosaur Killer” Impact Crater (2004+)
Research Assistants: Kaushik Das, Jan-Phillip Tiesel, Vijay Baiyya, Chris Best
Overview
Many geological datasets represent large three-dimensional areas or objects, but are ordinarily viewed and interpreted on conventional desktop displays. We developed tools to allow users to explore and annotate various geological datasets directly in VR, more naturally matching a geological interpreter’s 3D mental model. One project focused on visualizing datasets from the Chicxulub Impact Crater in the Yucatán Peninsula, believed to be related to sudden mass extinctions. These datasets include multiple elevation sets, GPS traces, magnetic fields, and gravity fields. A geologist marked interesting features in the datasets, compared different datasets to understand the level of consistency between them, and estimated impact energy. Use of this system has helped clarify interpretations of the topographical data.
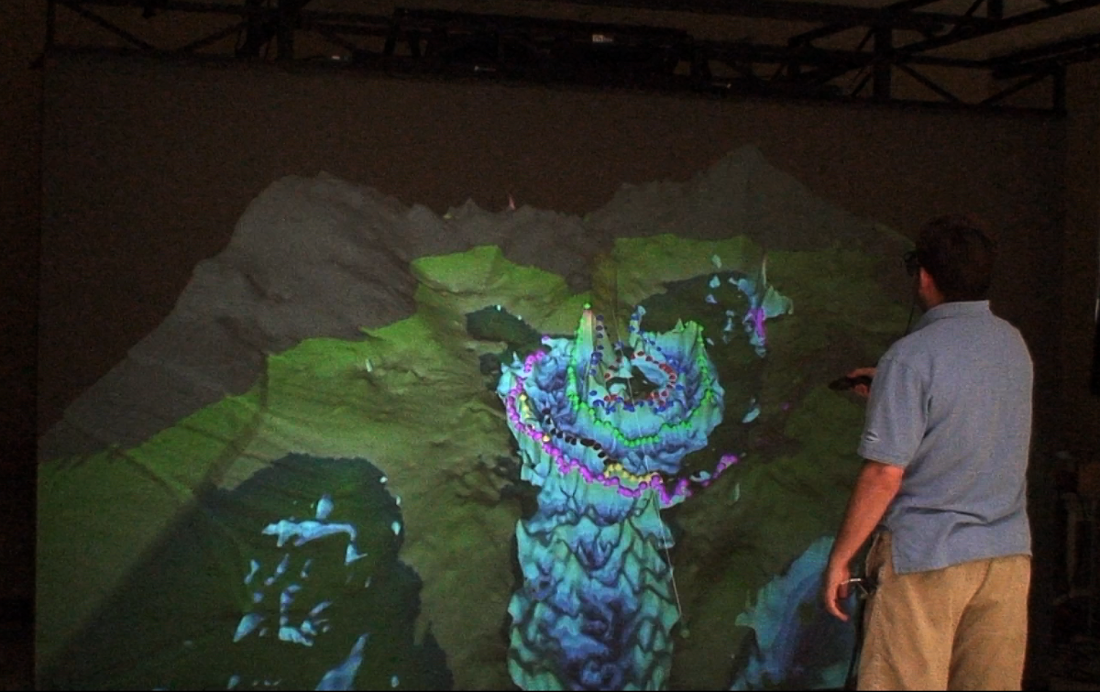
A user interacts with the gravity and gravity gradient datasets by marking points of interest (colored rings) and lining up features in the interpretations. Different spatial data are brought together to verify whether perimeter of the impact crater coincides between the different layers.
Publications
- GCAGS Paper describing the application, the dataset, and the hardware setup for users. (link)
Welding Simulation
Overview
Welders require substantial training and practice to learn their trade. Our MIG welding simulator allows trainees to gain initial welding experience and provides real-time visual and audio feedback about their movements and performance, without the expense of consumables or risks of fumes and gas. Beyond realistic visuals, additional guiding cues can be displayed about welding speed and resulting weld quality. VR Lab members worked with faculty from computer science and engineering to develop a low-cost VR welding station. Our role included granular synthesis methods for realistic audio, low-cost optical tracking, visual effects, and weld simulation components.
 Simulated MIG Welding for Advancement in Technical Training. Visual cues guide the user’s motion to teach proper welding height and speed. |
Publications
- Terrence Chambers, Amit Aglawe, Dirk Reiners, Steven White, Christoph W. Borst, Mores Prachyabrued, Abhishek Bajpayee, “Real-Time Simulation for a Virtual Reality-Based MIG Welding Training System”, March 2012 (vol. 15 no. 1), Virtual Reality (Springer), pp. 45-55.
- Steven A. White, Mores Prachyabrued, Terrence L. Chambers, Christoph W. Borst, Dirk Reiners, “Low-cost simulated MIG welding for advancement in technical training”, March 2011 (vol. 15 no. 1), Virtual Reality (Springer), pp. 69-81. (video)
- SPIE: Steven White, Dirk Reiners, Christoph W. Borst, Terrence L. Chambers, Mores Prachyabrued, “Virtual reality welder training”, Proceeding of SPIE Vol. 7525, The Engineering of Virtual Reality, Jan. 2010.
- IEEE VR reviewed demo: Steven White, Mores Prachyabrued, Dhruva Baghi, Amit Aglawe, Dirk Reiners, and Christoph Borst, “Virtual Welder Trainer”, IEEE VR 2009, pp. 303-304.
Soldier Simulation with Omnidirectional Treadmill
Overview
Running military simulations in VR, as opposed to on 2D screens or in real-life, offers a promising compromise between realism and cost. VR Lab members were part of the CREATE group that worked on a VR simulation environment to support human factors studies of soldier equipment. This project used an omni-directional treadmill in a CAVE-like display for soldier movement in a VR scene. Our role focused on infrastructure development, for example, integrating tracking extensions into the simulation framework, and laying out the overall framework.

Dismounted Soldier Simulation with the MTS 3rd generation Omni-Directional Treadmill
Isaac Verot Coulee Watershed Visualization (2009-2011)
Research Assistant: Jan-Phillip Tiesel
Overview
Hydrologists at UL Lafayette are studying the relationships between rainfall patterns and water runoff to improve weather effect models. For this they incorporate data from NEXRAD radars, rain gauges, disdrometers, a micro-radar, streamflow gauges, and weather stations. We developed a system that helps them visualize sensor data and demonstrate and evaluate their models and related weather data. This application also helps civil engineering students understand rainfall and watershed events.
Our VR system provided a windowing interface for laying out multiple time-varying datasets and browsing through time using volumetric lenses (link) with playback controls. Spatio-temporal lenses provide time offsets to a specified area of the dataset for viewing multiple time points simultaneously to explore cause-effect relationships. Speed and direction of data playback can be controlled, and time markers can also be inserted for later reference.
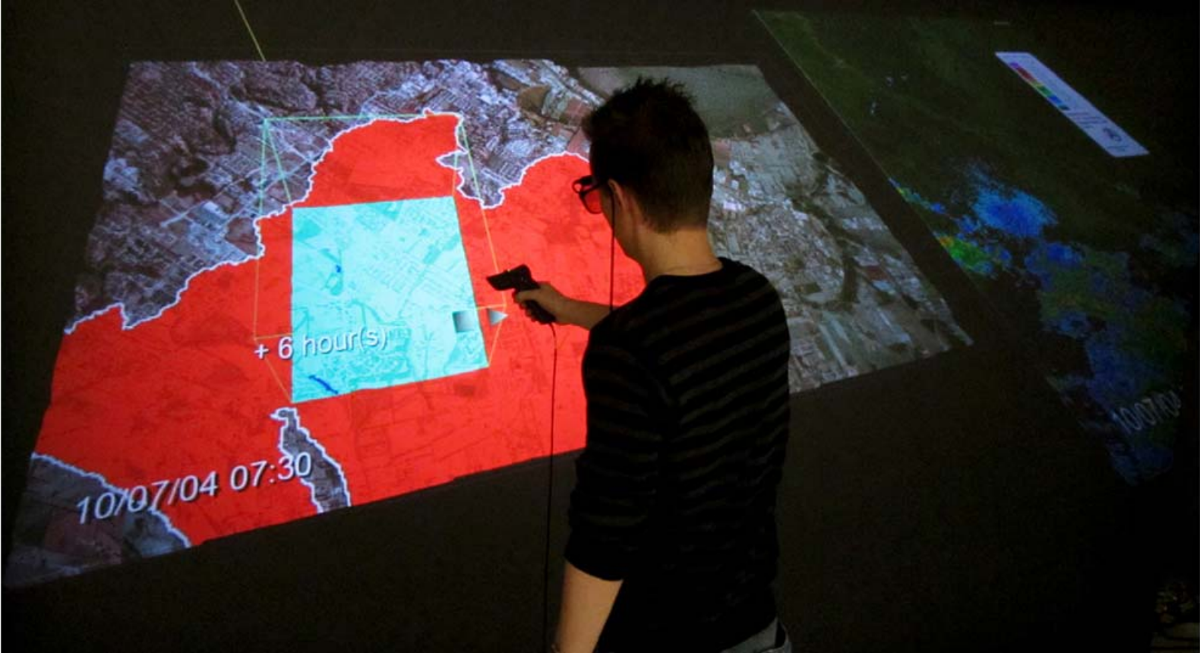
A user in a projection display views distributed rainfall in Lafayette parish from 10/07/04 at 07:30 hrs. Using a relative time warp lens, the user also sees data from the same location in an offset time period. This particular lens shows increased rainfall 6 hours beyond the current context.
Also see a clip of the application in the Visualization Examples Video.
Publication
- TVCG Paper primarily describing the lenses used in the system, with brief overview of the application. (doi)
Well Log Visualization for Coalbed Methane Exploration (2010-2013)
Research Assistant: Jan-Phillip Tiesel, Mores Prachyabrued
Overview
For petroleum engineers to extract coalbed methane (a natural gas) from well reservoirs, it is important for them to be able to understand underground layers and health and potential of wells. Our well log visualization system displays information taken from multiple well log curves, showing sensor data that is studied to assess coal quality, gas contents, gas and water production rates, and gas and water chemistry of coalbed wells. Information is visualized underneath terrain geometry, where users can navigate through and interact with the data in an immersive VR environment. We investigated the use of ray-based and smartphone VR interactions for interactive well log exploration (see Handymap Selection Interface under 3D Interaction).
This application displays multiple well log curves (spontaneous potential and resistivity) positioned underneath terrain geometry. The geological and petroleum industry could benefit from this by being able to manage, display, and interpret coalbed natural gas datasets in immersive VR systems. A depth cursor and a scalable colored pane are available for interpretation. We are investigating the use of a handheld touch interface to address display clutter and precision problems found in standard ray interaction approaches in well log selection (see Handymap Selection Interface under 3D Interaction). Possible future work includes support for “geobodies” – three dimensional volumes enclosing space interpreted to be/contain a defined rock type, and the use of handheld touch devices to improve well log interpretation and annotation tasks.
Also see a clip of the application in the Handymap Selection Interface Video.
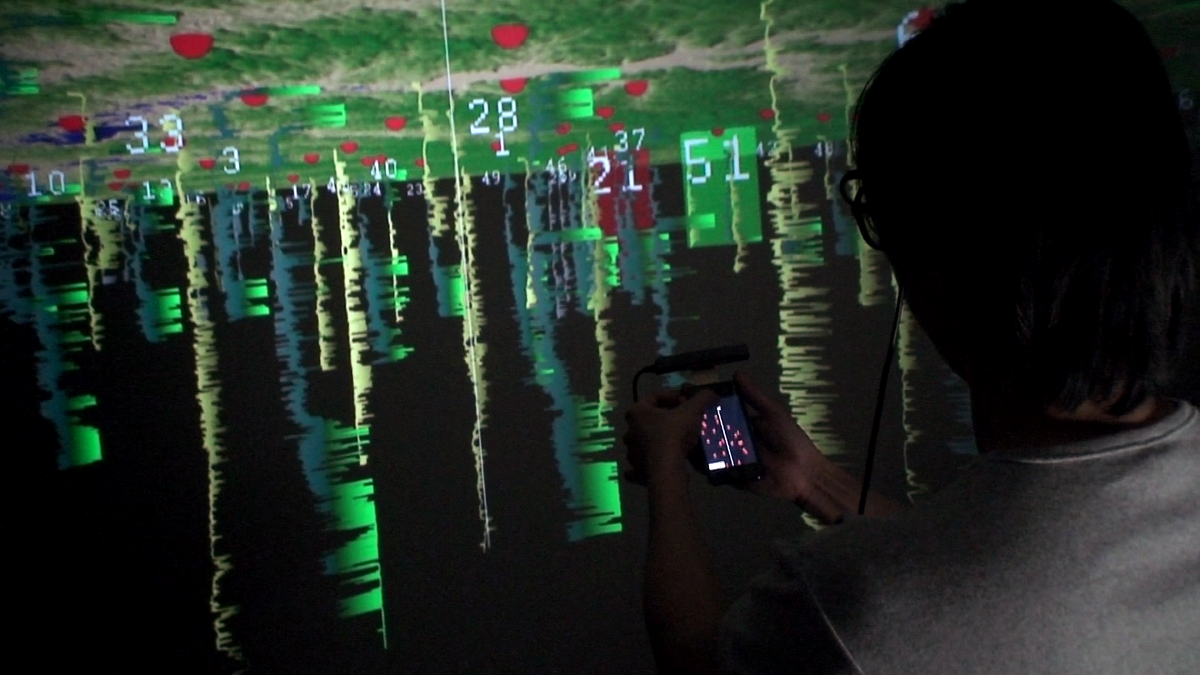
A user inspects well logs from Wilcox Group of North Louisiana to understand rock layers. The well logs are seen as sensor curves beneath a terrain. A user can mark features along logs and line up multiple logs to correlate features between them. Extended log details are shown on a handheld touch display (smartphone).
Publications
- Mores Prachyabrued, David Ducrest, and Christoph W. Borst, “Handymap: A Selection Interface for Cluttered VR Environments Using a Tracked Hand-held Touch Device”, ISVC (Visual Computing) 2011, pp. 45-54. (PDF)
- Prabhakar V. Vemavarapu and Christoph W. Borst, “Evaluation of a Handheld Touch Device as an Alternative to Standard Ray-based Selection in a Geosciences Visualization Environment”, Workshop on Off-the-Shelf Virtual Reality (OTSVR) at IEEE VR 2013. (PDF)
Immersive LIDAR Visualizations
LIDAR, or Light Detection And Ranging, uses light in the form of pulsed lasers to measure distances to a surface, creating point clouds of object or terrain surfaces. Several of our lab’s projects use LIDAR data.
Airborne LIDAR Terrain Visualization (2008+)
Research Assistant: Jan-Phillip Tiesel, Vijay Baiyya, Chris Best, Kaushik Das
We developed tools to view and interpret digital elevation models from helicopter-mounted LIDAR scans. These tools have been used to interpret cross-cutting features in the Lafayette region and to incorporate terrain visualizations into hydrology applications.
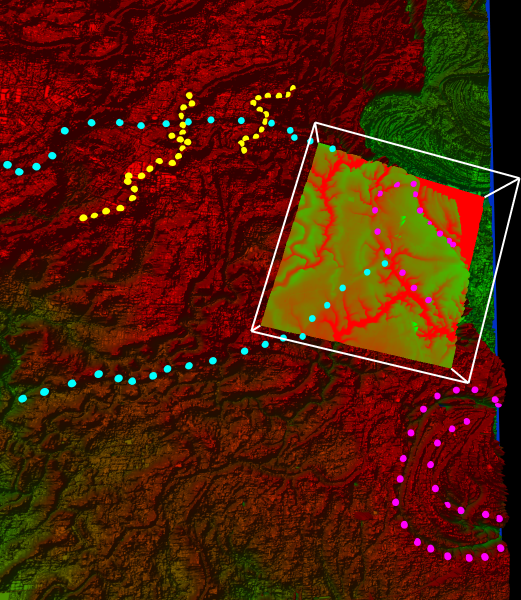
Cross-cutting relationships of features on the Pleistocene prairie complex near Lafayette, Louisiana
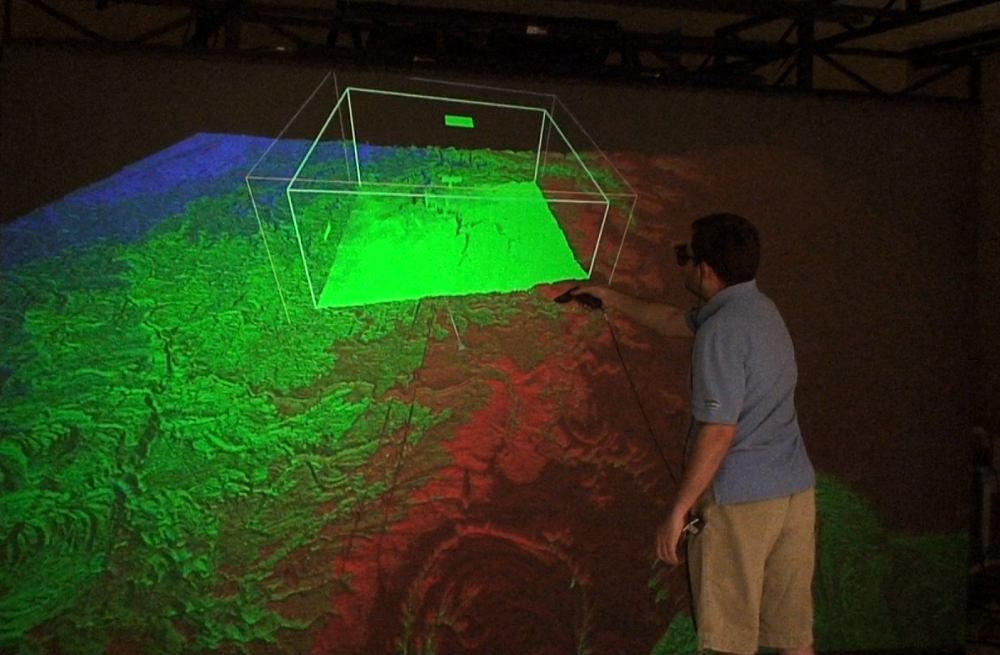
A user inspects LIDAR scans of the Lafayette region. An interactive lens acts as a filter to emphasize troughs.
Publications
- Gary L. Kinsland, Christoph W. Borst, Jan-Phillip Tiesel, Kaushik Das, and S. Kushiyama, “Cross-Cutting Relationships of Features on the Pleistocene Prarie Complex near Lafayette, Louisiana: Imaged with LIDAR and Interpreted in 3D Virtual Reality”, Gulf Coast Association of Geological Societies Transactions 2009, pp. 413-424.
Visualization of Ground-based LIDAR: Bridge Inspection (2008-2009)
Research Assistant: Phanidhar Raghupathy
Bridges can endure significant structural wear over the course of years. Monitoring the progress of wear is integral to predicting structural failures and marking points for repair. In this application, users can inspect large point cloud representations of a bridge across multiple time periods, with each time period generated from a LIDAR dataset, to identify faults and points of wear.
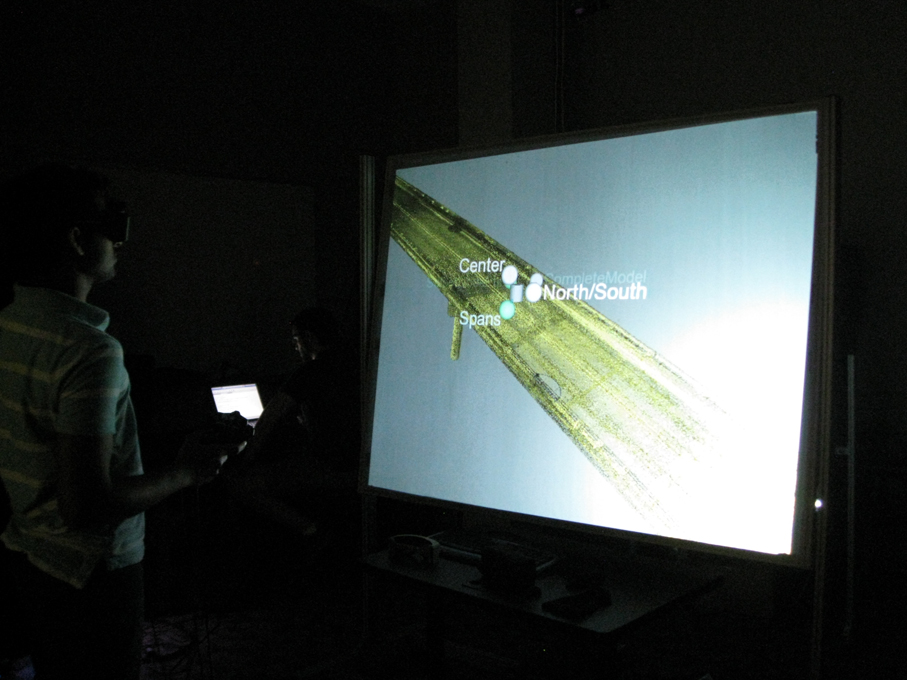
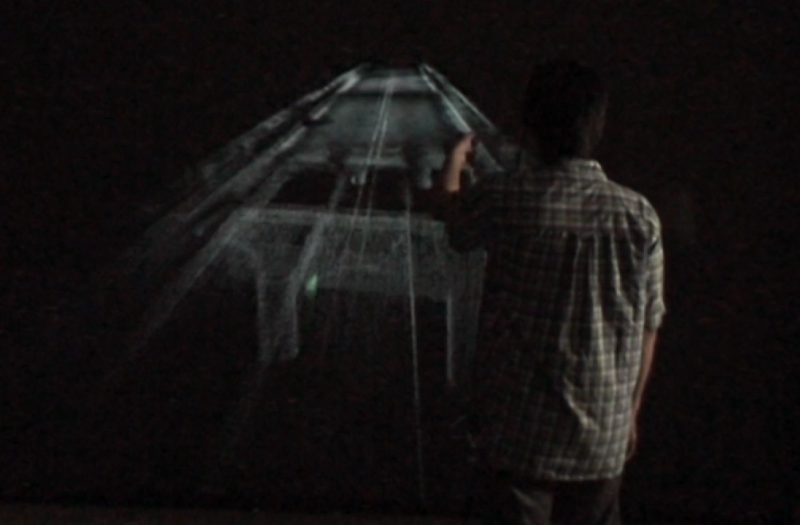
A user inspects 3D scans of a highway overpass on Interstate-10 near Lafayette, using the Menu system developed by Kaushik Das to select different spans of the bridge in different time periods.